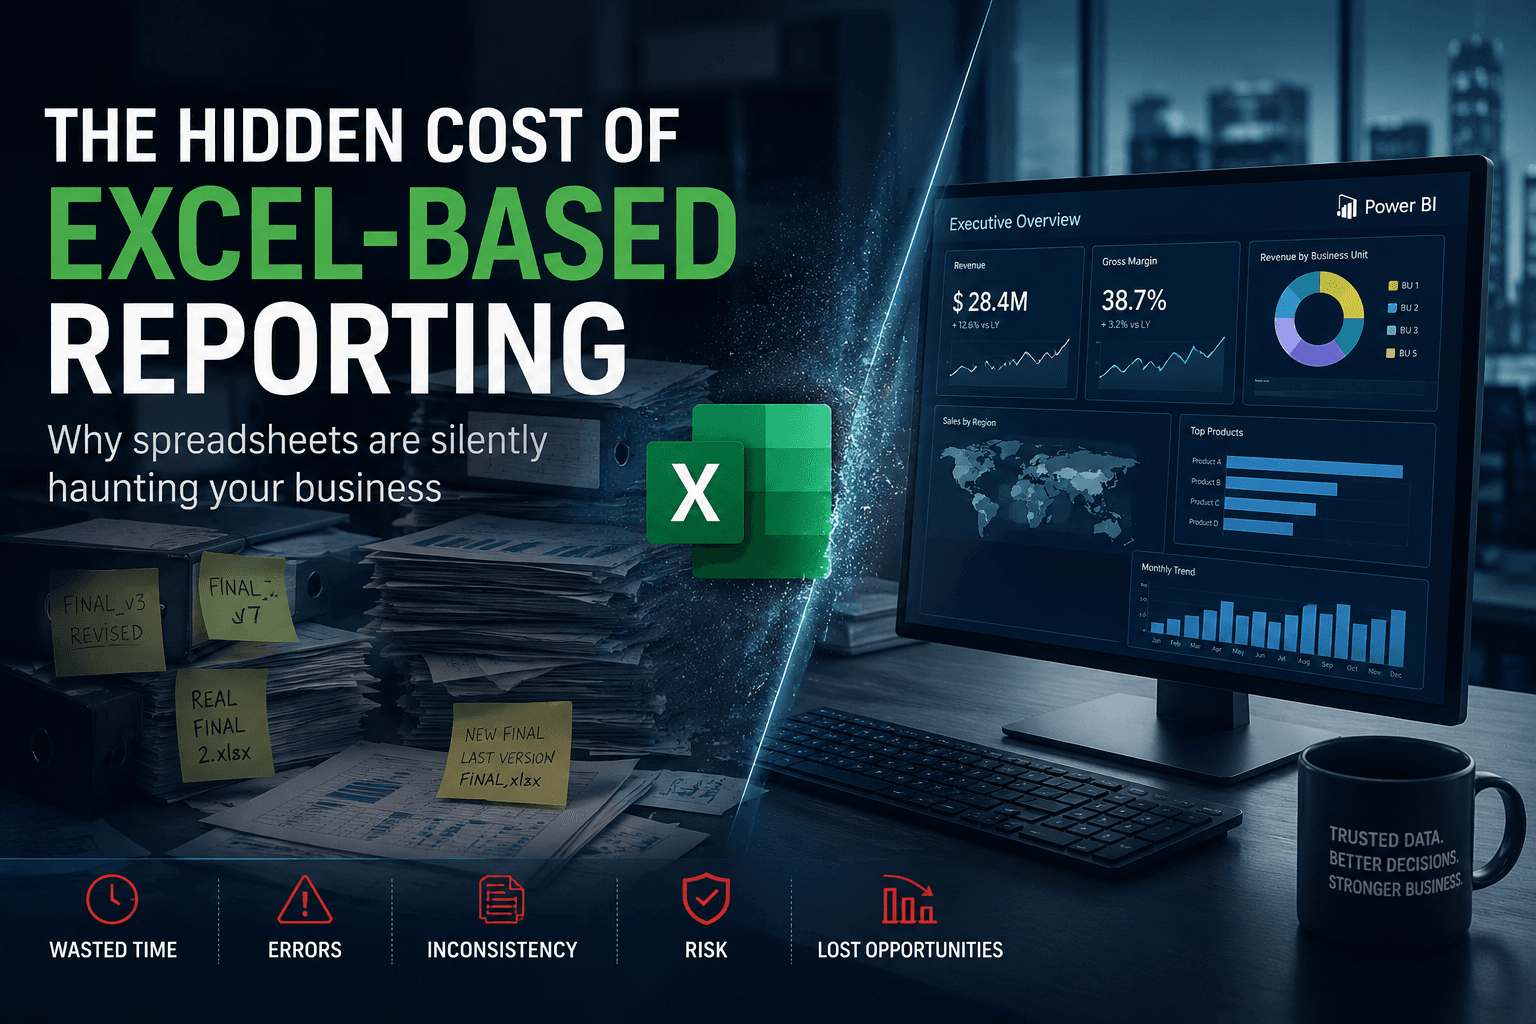
The Hidden Cost of Excel-Based Reporting
Excel remains one of the most widely used tools in enterprise reporting.
And for good reason: it is flexible, accessible and fast for ad hoc analysis.
But as organizations scale, Excel often evolves from a support tool into a critical operational dependency.
At this stage: the hidden costs become enormous.
Many companies believe they have a reporting system.
In reality: they have hundreds of disconnected spreadsheets silently driving operational decisions.
The consequences are rarely visible immediately.
But over time, Excel-based reporting creates:
- reporting inconsistency
- operational delays
- duplicated work
- governance issues
- KPI conflicts
- decision-making friction
And eventually: organizations lose trust in their own numbers.
Why Excel Reporting Never Truly Disappears
Even after implementing:
- ERP systems
- Power BI
- Snowflake
- SAP BW
- dashboards
- data warehouses
Excel still survives.
Why?
Because enterprise reporting environments are often:
- incomplete
- fragmented
- too slow
- too rigid
- poorly aligned with operational reality
So business teams create local reporting workarounds.
Usually: they start with “temporary” Excel files.
But temporary files become:
- critical operational trackers
- unofficial reporting layers
- manual KPI correction systems
- shadow databases
Eventually: Excel becomes the real operational system.
The Real Problem Is Not Excel Itself
Excel is not the enemy.
The real problem is: organizations using Excel to compensate for structural reporting weaknesses.
For example: teams use Excel because:
- KPIs are inconsistent
- dashboards are missing data
- ERP reports are difficult to use
- data refreshes are too slow
- operational workflows are fragmented
Excel becomes a survival mechanism.
1. Multiple Versions Of The Truth
This is one of the most dangerous consequences.
Different teams maintain:
- different files
- different formulas
- different filters
- different business logic
The result?
The same KPI produces: different numbers across departments.
Example:
- Finance reports one revenue number
- Sales reports another
- Operations reports another
- Executive dashboards show something else
Nobody knows which number is correct anymore.
2. Massive Time Waste
Enterprise teams spend enormous amounts of time:
- copying data
- cleaning files
- reconciling numbers
- updating spreadsheets
- correcting formulas
- rebuilding reports manually
Most organizations dramatically underestimate this cost.
In many environments: analysts spend more time fixing reporting than analyzing business performance.
3. Reporting Becomes Person-Dependent
This is extremely common.
One person becomes: “the Excel person”.
Only they understand:
- the formulas
- the macros
- the manual adjustments
- the hidden business logic
If that person leaves: the reporting process becomes unstable overnight.
This creates major operational risk.
4. Excel Breaks Governance
Modern enterprise reporting requires:
- controlled access
- traceability
- centralized logic
- auditability
- governance
Excel struggles with all of these.
Problems quickly appear:
- duplicated files
- outdated versions
- uncontrolled edits
- missing audit trails
- inconsistent business rules
At scale: this becomes impossible to govern properly.
5. Operational Decisions Slow Down
When reporting is fragmented: decision-making slows dramatically.
Teams spend time:
- validating numbers
- reconciling files
- debating KPI logic instead of:
- executing operations
- improving performance
- reacting to business events
The organization becomes slower operationally.
The Psychological Impact Nobody Talks About
This is rarely discussed, but it is one of the biggest hidden problems.
Once business users stop trusting reports: they stop trusting dashboards entirely.
Then: every meeting becomes:
- “Where did this number come from?”
- “My file says something different.”
- “Which report is the latest version?”
Eventually: reporting creates anxiety instead of clarity.
Why This Problem Gets Worse With Scale
Small organizations can survive with Excel-heavy reporting.
Large organizations cannot.
As companies scale:
- entities multiply
- business units expand
- reporting complexity increases
- governance requirements grow
- operational coordination becomes harder
Excel fragmentation scales exponentially.
What Modern Enterprise Reporting Actually Requires
Organizations need:
- centralized reporting foundations
- governed KPI definitions
- semantic consistency
- automated refresh pipelines
- reliable BI environments
- controlled transformation layers
The objective is not to eliminate Excel completely.
The objective is: making Excel optional again.
The Shift Toward Operational BI Ecosystems
Modern organizations are moving toward:
- Power BI semantic models
- Snowflake architectures
- centralized reporting layers
- governed KPIs
- operational dashboards
- cloud-native reporting ecosystems
Not because dashboards are “modern”.
But because operational complexity now requires scalable reporting foundations.
Why Many Reporting Transformations Still Fail
A common mistake: companies focus on visualization before fixing reporting foundations.
They invest heavily in:
- dashboard redesigns
- UX improvements
- AI features
- new BI tools
But ignore:
- KPI governance
- reporting consistency
- operational workflows
- data ownership
Without these foundations: new dashboards simply reproduce old reporting problems.
What Enterprise Teams Actually Want
Most business users do not care about:
- AI buzzwords
- fancy charts
- complex analytics
What they really want is simple:
“Can I trust the numbers?”
That is the real challenge of enterprise reporting.
How Datilog Helps Organizations Reduce Reporting Fragmentation
Datilog supports organizations modernizing:
- reporting environments
- Power BI ecosystems
- SAP reporting structures
- operational dashboards
- KPI governance frameworks
Our approach focuses on:
- reducing reporting fragmentation
- aligning KPI logic
- improving operational visibility
- centralizing reporting foundations
- restoring trust in business reporting
Because enterprise reporting should accelerate operations — not slow them down.
Want to reduce reporting fragmentation and improve trust in your business data?
👉 Discuss your reporting environment with Datilog
Related Datilog resources
To go deeper into this topic, explore these Datilog resources:


