Why Most KPI Dashboards Fail After 6 Months
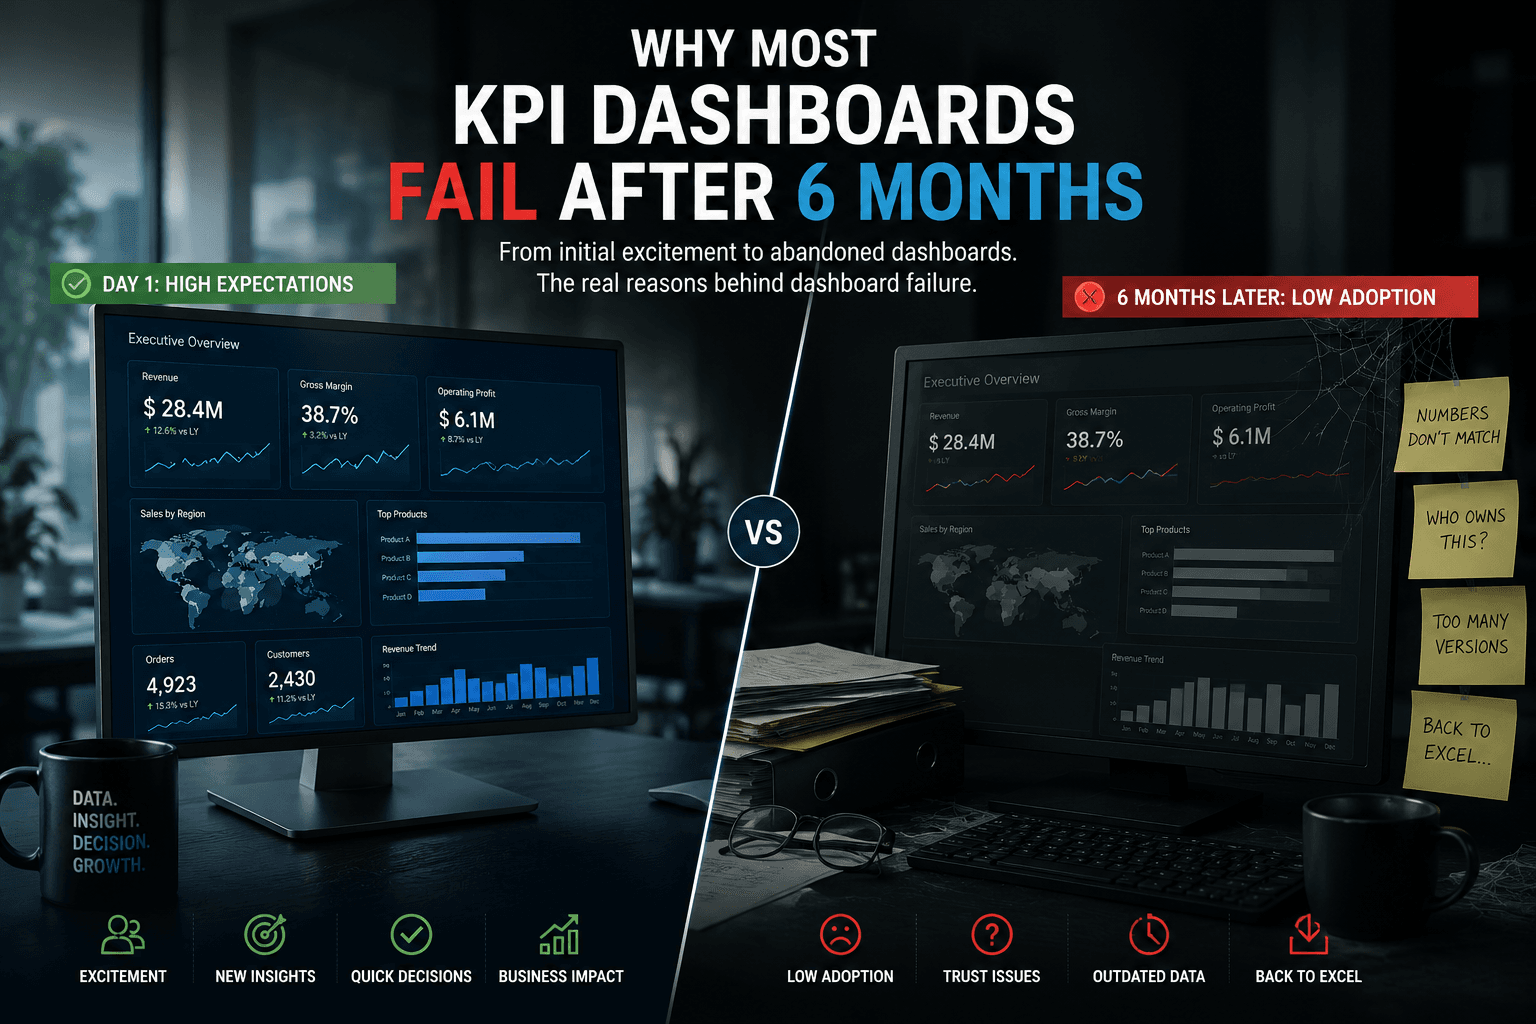
At launch, most KPI dashboards look successful.
The organization is excited:
- executives receive new visualizations
- business teams explore dashboards
- management sees “digital transformation”
- reporting modernization appears complete
For a few weeks: usage is high.
Then slowly: something changes.
Business users stop opening the dashboards.
Teams return to:
- Excel exports
- manual files
- offline calculations
- old reports
- side spreadsheets
Six months later: the dashboard technically still exists — but operationally, it is no longer driving decisions.
This happens far more often than most organizations admit.
And the problem usually has nothing to do with Power BI, Tableau or the visualization tool itself.
The real issue is deeper.
Most KPI dashboards fail because organizations focus on visualization… instead of operational trust and reporting usability.
Dashboards Don’t Fail Technically
This is important.
Most dashboards do not fail because:
- charts are ugly
- visuals are slow
- colors are bad
- BI tools are weak
They fail because: business teams stop trusting or using them operationally.
A dashboard only creates value if it becomes part of:
- operational decision-making
- management routines
- business workflows
- reporting culture
Without that: it becomes a static visualization layer.
1. KPIs Are Poorly Defined
This is probably the biggest reason dashboards collapse over time.
Different teams interpret KPIs differently.
Example: “Revenue” may mean:
- invoiced sales
- booked orders
- shipped quantities
- net sales
- gross sales
- accounting revenue
At launch: nobody notices.
But after months: departments begin comparing numbers.
Conflicts appear.
Trust decreases.
Eventually: teams stop relying on the dashboard entirely.
2. Dashboards Are Built For Executives — Not Operations
Many BI projects focus heavily on executive visibility.
The result: beautiful dashboards… with little operational usefulness.
Operational teams need:
- actionable visibility
- workflow context
- drill-down capabilities
- operational alerts
- granular business logic
But many dashboards only provide: high-level KPIs with no operational depth.
Business users quickly return to Excel because: they still need real operational analysis.
3. Business Reality Changes Faster Than Dashboards
Organizations evolve constantly.
Examples:
- new entities
- changing products
- reorganizations
- mergers
- updated processes
- new reporting requirements
But dashboards often remain frozen after deployment.
Over time: the dashboard reflects an outdated business reality.
This creates frustration.
Eventually: users stop trusting the reports.
4. Nobody Owns KPI Governance
Many organizations assume: “the BI team owns reporting.”
But reporting governance requires collaboration between:
- finance
- operations
- sales
- supply chain
- IT
- BI teams
Without governance: KPI logic becomes fragmented.
Small inconsistencies accumulate over time until: the dashboard becomes unreliable.
5. Data Quality Problems Slowly Destroy Trust
This is one of the most underestimated issues.
Even small inconsistencies:
- missing records
- delayed refreshes
- duplicate values
- incorrect mappings
can destroy confidence.
And once users begin questioning data quality: dashboard adoption drops rapidly.
Trust is extremely difficult to rebuild afterward.
6. Dashboards Become Too Complex
This happens frequently in enterprise environments.
Over time: organizations keep adding:
- more filters
- more KPIs
- more tabs
- more visuals
- more calculations
Eventually: the dashboard becomes cognitively exhausting.
Instead of simplifying decision-making, it overwhelms users.
Complexity slowly kills adoption.
7. Reporting Is Disconnected From Operational Workflows
This is critical.
Many dashboards exist separately from daily operations.
But business users do not want: “another reporting tool”.
They want: visibility integrated into operational execution.
If dashboards are disconnected from:
- operational meetings
- planning cycles
- workflow systems
- performance management
they become passive visualization layers.
And passive tools eventually disappear.
The Hidden Psychological Problem
This is rarely discussed.
Once users stop trusting dashboards, they stop trusting transformation initiatives themselves.
The organization begins hearing:
- “the numbers are never accurate”
- “Power BI is unreliable”
- “we still need Excel”
- “the dashboard doesn’t reflect reality”
At this stage: the issue is no longer technical.
It becomes organizational.
Why Dashboard Projects Keep Repeating The Same Mistakes
Most BI projects focus heavily on:
- visualization design
- dashboard quantity
- UX polish
- AI integrations
- executive presentations
But ignore:
- operational workflows
- governance
- KPI ownership
- reporting culture
- decision processes
A dashboard is not just a reporting tool.
It is part of the operational system of the company.
What Successful BI Environments Actually Prioritize
The most successful enterprise reporting ecosystems focus on:
1. KPI Governance
Shared business definitions.
2. Operational Relevance
Dashboards aligned with real workflows.
3. Reporting Simplicity
Clear visibility without cognitive overload.
4. Data Reliability
Consistent refreshes and controlled logic.
5. Continuous Evolution
Dashboards evolving with business operations.
The Future Of Enterprise Dashboards
Modern reporting environments are evolving toward:
- governed semantic models
- operational analytics
- centralized KPI frameworks
- embedded reporting
- real-time visibility
- workflow-integrated dashboards
But the future of BI is not about “more dashboards”.
It is about: creating reporting environments business teams genuinely rely on.
What Business Teams Actually Want
Most operational users do not care about:
- advanced visual effects
- AI-generated charts
- dashboard animations
They care about:
- clarity
- reliability
- operational usefulness
- fast answers
- trusted KPIs
That is what creates long-term adoption.
How Datilog Helps Organizations Build Sustainable BI Environments
Datilog supports organizations working on:
- Power BI ecosystems
- SAP reporting environments
- KPI governance
- operational dashboards
- reporting modernization
- enterprise analytics
Our approach focuses on:
- operational visibility
- reporting trust
- KPI consistency
- dashboard usability
- long-term reporting adoption
Because dashboards should support operational execution — not become another abandoned reporting project.
Want to improve dashboard adoption and restore trust in your reporting environment?
👉 Discuss your BI challenges with Datilog
Related Datilog resources
To go deeper into this topic, explore these Datilog resources:


